
The Challenge
We took on the challenging task of upgrading the data architecture for a leading asset management company to support more efficient dashboard visualization.
The company was dealing with an enormous dataset, over 500 TB, sourced from 47 different places, along with daily CSV data generated by clients. Their existing system was struggling to keep up.
Our clear objective was to enhance dashboard reporting for C-level executives and optimize their MSSQL Data Warehouse. By implementing innovative visualization techniques and reorganizing their data flow, we significantly improved the visual reporting capabilities and streamlined data integration processes.
Explore more
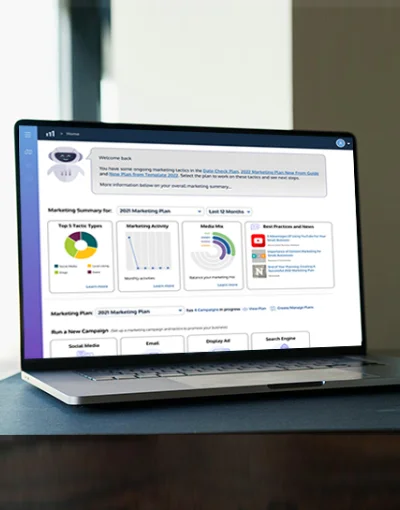
Marketing Product
Users can boost their marketing efforts with effectiveness and accuracy through an industry-specific template library, ideas for ongoing enhancement
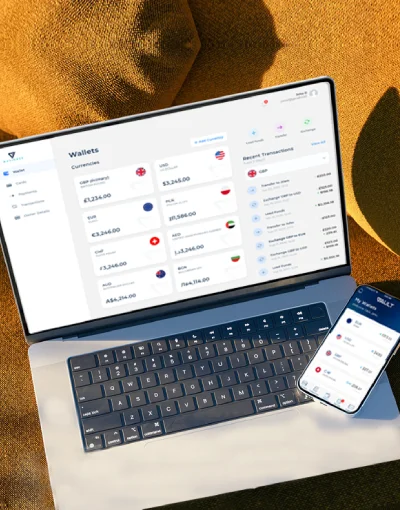
Vault Business Platform
A web app designed for business users to manage global finances with ease by creating a digital wallet, load funds using currencies like GBP, USD, EUR, PLN, and CHF.
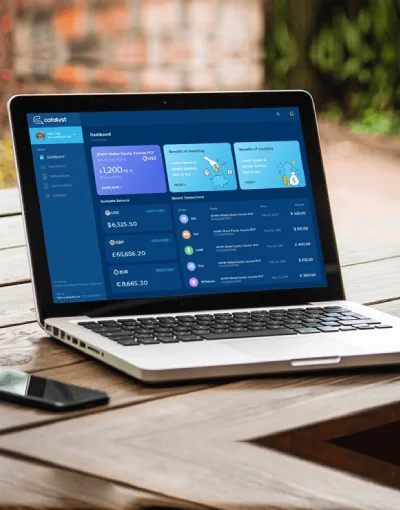
Investment Platform
The platform offers smooth trading, real-time portfolio analytics, and easy fund management, enhancing financial control and investment experience.
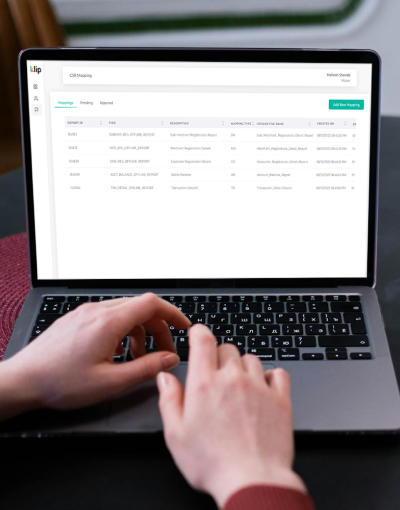
Digital
E-Wallet
This enables enhanced control, flexibility, and data security for optimized operational stability and efficiency in dynamic business environments.